Flows and Runs
A Flow defines how an experiment is executed, including device fabrication, data collection, and data analysis. Flows are a core concept in Balthazar and are required to run, track, and reproduce experiments.
Why Flows matter
Flows ensure that experiments are:
- Reproducible: the same steps can be repeated at any time
- Versioned: changes to experimental logic are tracked
- Reviewable: experiment execution can be inspected and audited
All experiments in Balthazar are executed through Flows.
What is a Flow?
A Flow is a standard Python script that the Balthazar Runner executes on the Runner's computer. While the script is running, Balthazar automatically captures its logs, plots, and Run metadata.
A Flow can also take Inputs (parameters set before each Run, like a voltage range or a number of repetitions) and produce Outputs (summary values saved from the Run, like a peak height).
What is a Run?
Every time a Flow is started, Balthazar creates a Run: the saved record of that one execution. A Run captures everything the Flow produced, so it is always possible to go back and see exactly what happened:
- the Inputs it used and the Outputs it produced (see Inputs and Outputs),
- every plot and log message, and the names of any files it wrote (its Artifacts),
- who started it, when, and the exact version of the code that ran.
Because each Run is stored, it is easy to compare Runs, reproduce an old result, or start the Flow again with the same Inputs.
Creating and starting a Flow
Follow the steps below to create and start a first Flow.
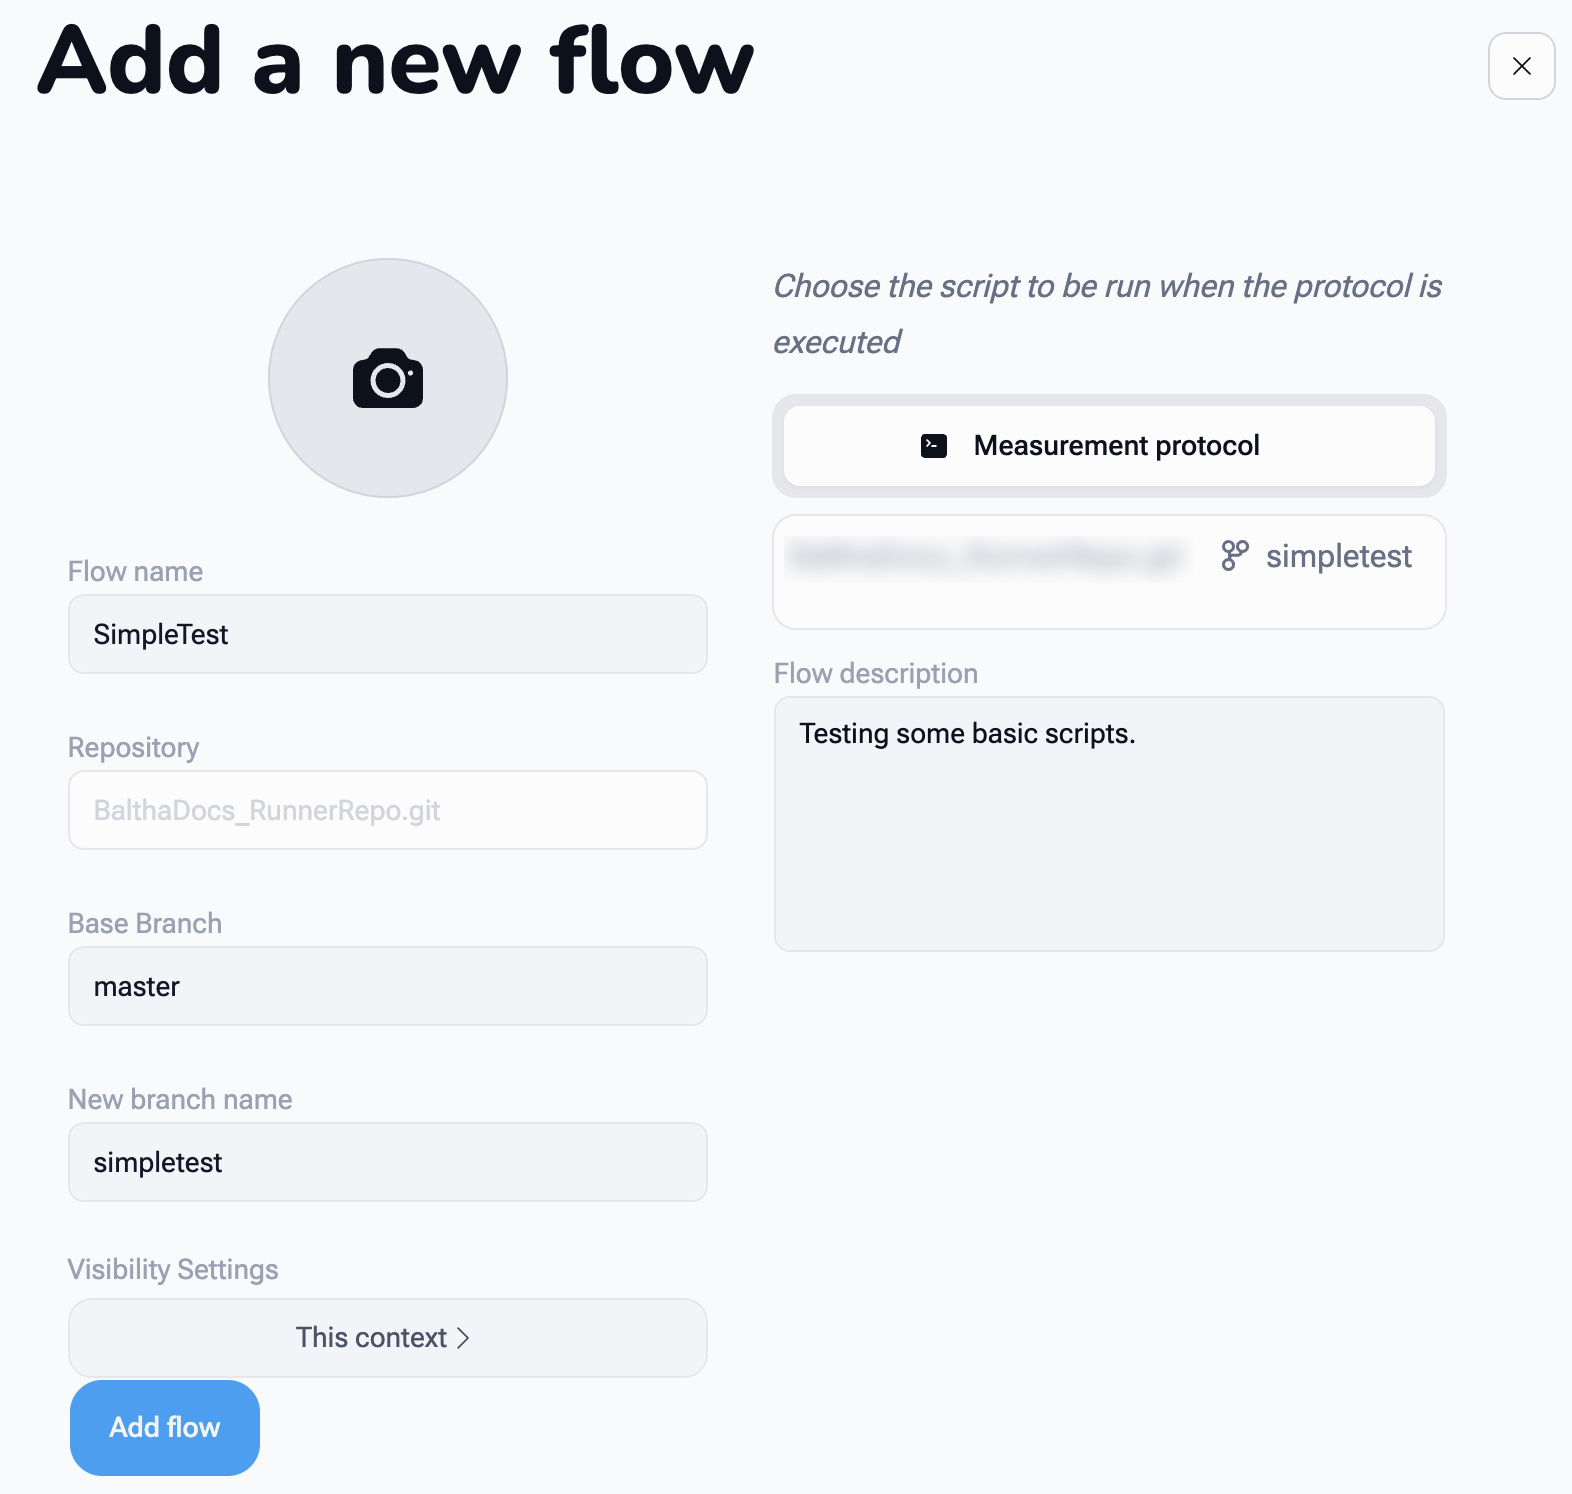
1. Create a new Flow
- Choose a Flow name (for example,
SimpleTest) - Click Add flow
2. Open the Workbench
The Workbench is the environment where Flows are developed, edited, and executed: it has a file editor, runs scripts interactively, and shows their output live.
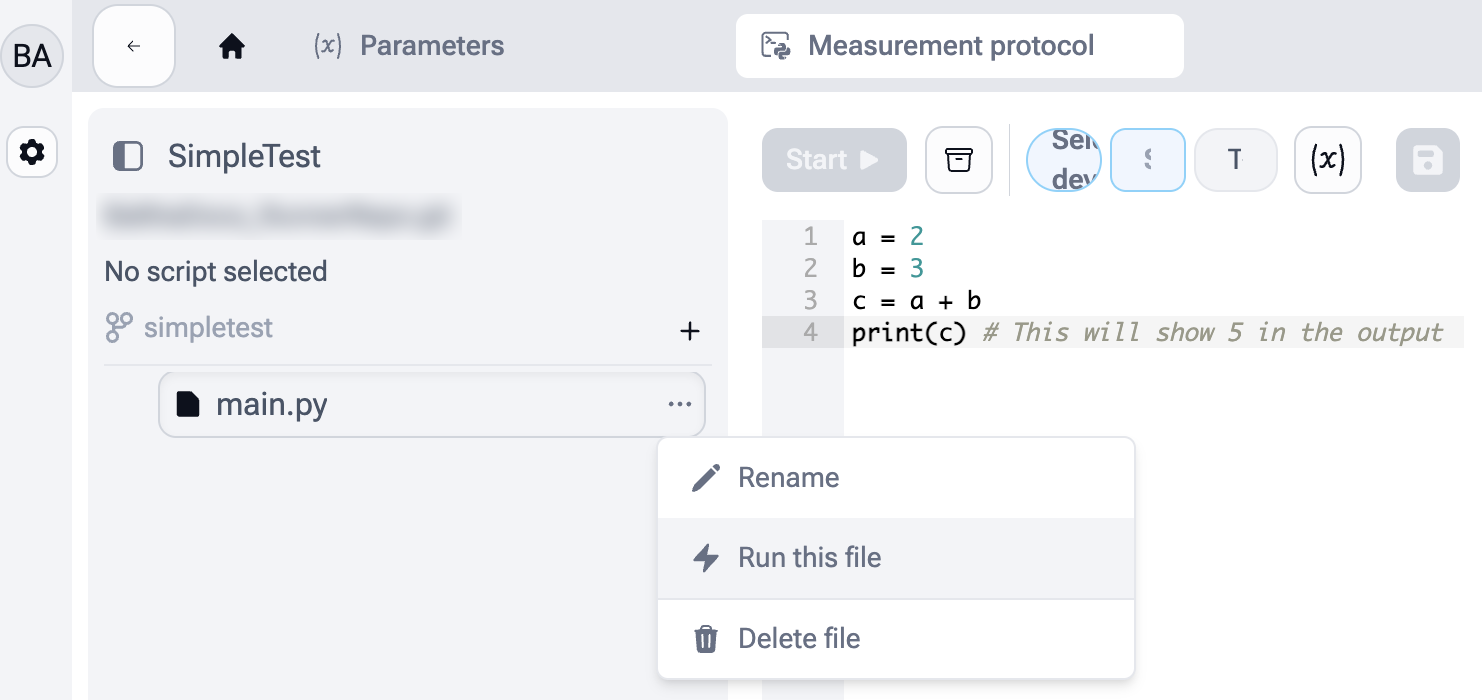
- After Add flow, the Flow's page opens. Click its Workbench button. The Flows list also has a Workbench button next to each Flow
- Create a new file from a folder's three dots menu with New file, for example
main.py. This file contains the main logic of the Flow
From here, Python code is written as usual, including imports, computations, and plotting. When executing a Flow, Balthazar captures logs and plots for review both during and after the Run.
3. Write a simple script
Add some code to main.py, for example:
a = 2
b = 3
c = a + b
print(c)  # This will show 5 in the output
4. Run the script
- Click the three dots next to the filename
- Select Run this file to choose the main file of the Flow
5. Select a device and Runner
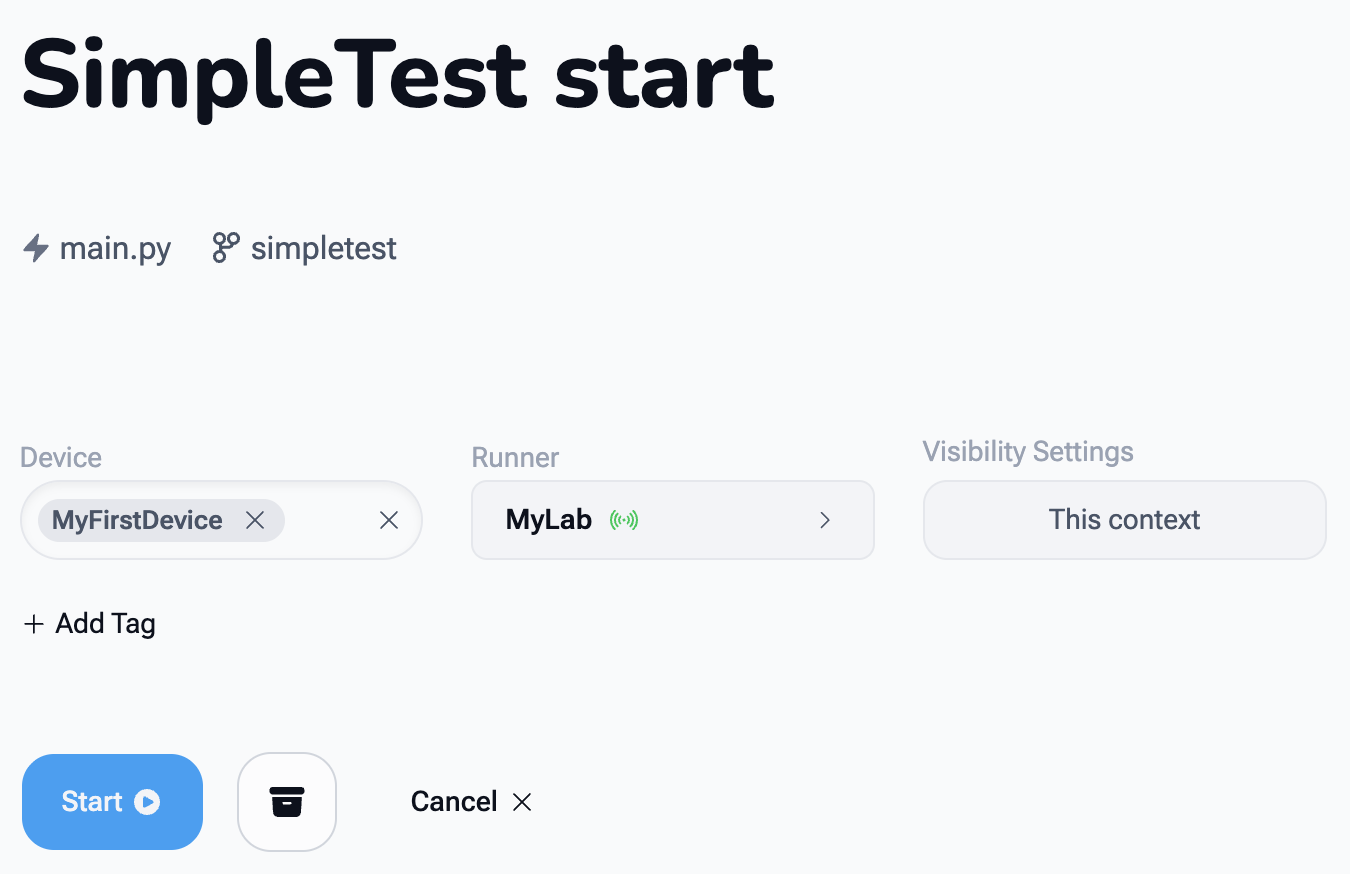
At this point, the Flow is ready to start:
-
Select a Device
(see Creating a Device if the Device list is empty) -
Select a Runner
(see Installing a Runner if no Runner is available)
6. Start the Flow
- Click the Start button
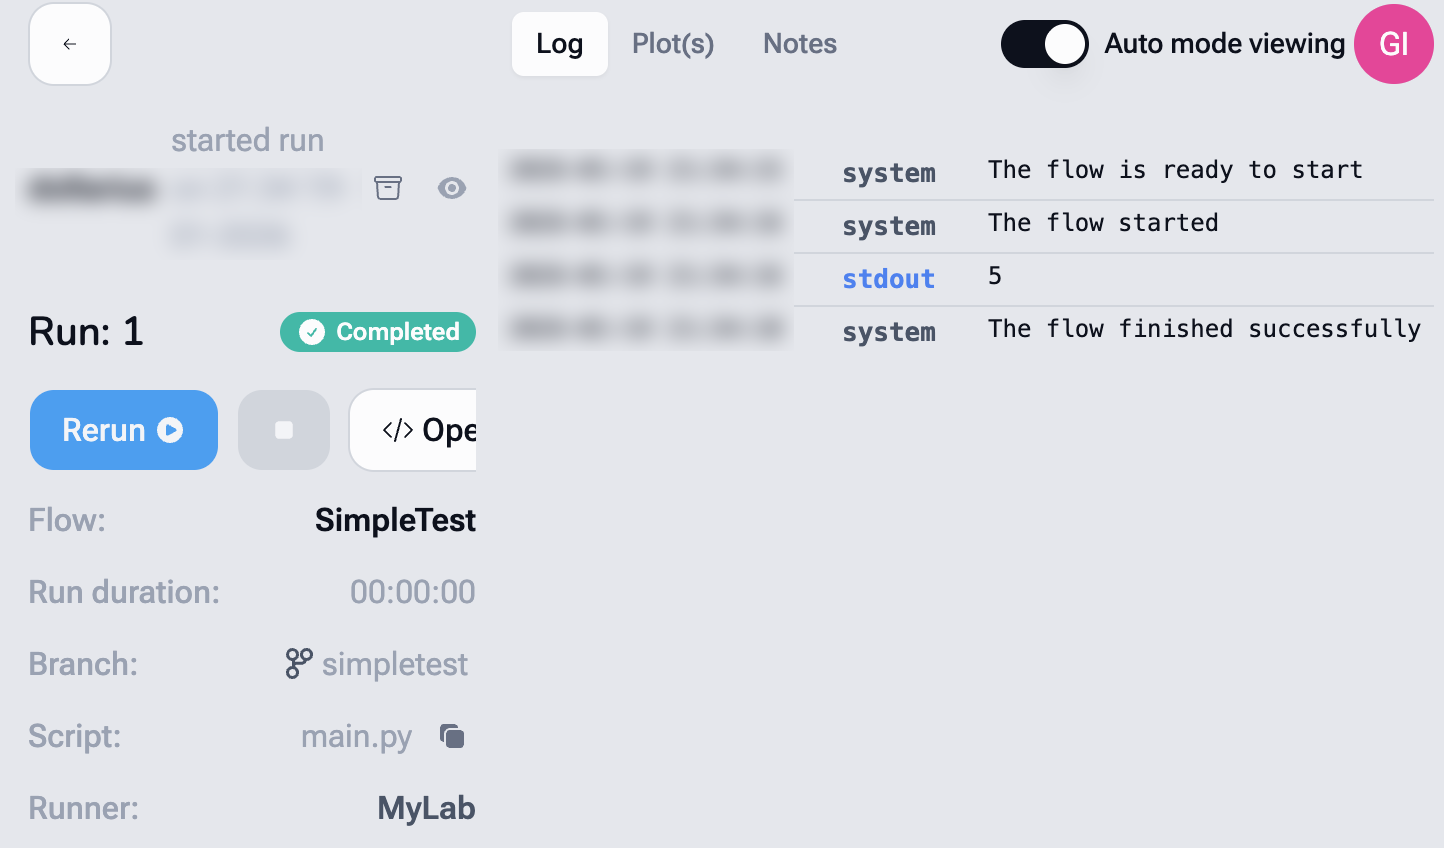
The script executes on the selected Runner, and the standard output (stdout) is automatically captured by Balthazar.
In this example, the output 5 is recorded as part of the Flow execution.
Live plotting
Balthazar integrates seamlessly with standard Python libraries installed on the machine running the Balthazar Runner.
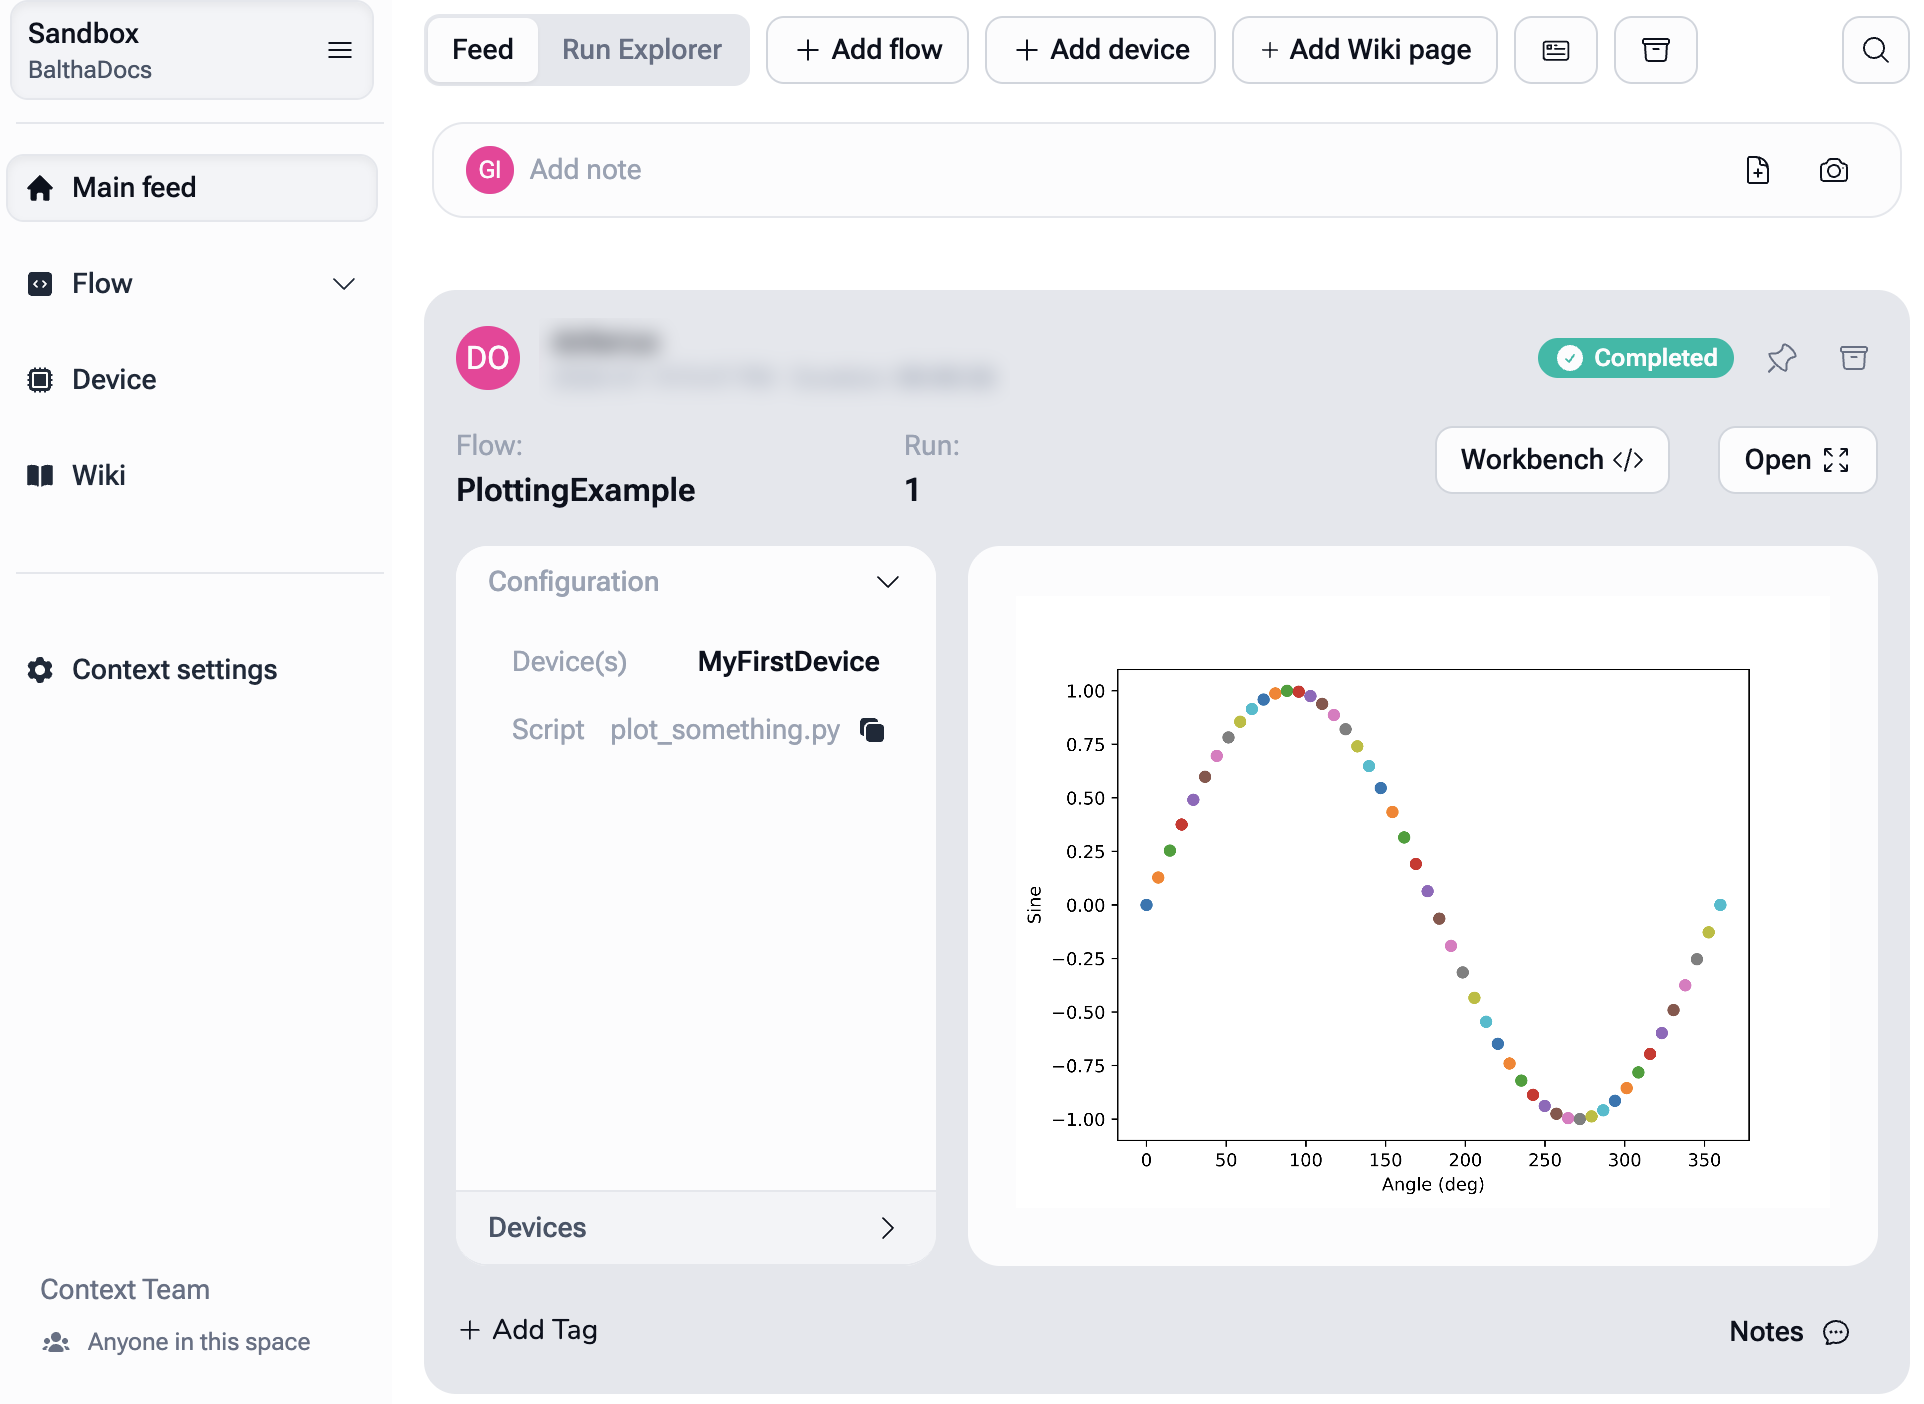
Matplotlib plots made inside a Flow are displayed in Balthazar each time the figure is drawn: call plt.show() when a plot is ready (plt.pause(...) and plt.savefig(...) also work). A figure that is never shown does not appear. This live plotting makes it possible to:
- Inspect results during the Run, as plots are captured in real time
- Review results after the Run, with plots stored alongside the Run's metadata
Example: Generating a live plot
import numpy as np
import matplotlib.pyplot as plt

# Generate data
x = np.linspace(0, 360, 50)
y = np.sin(np.deg2rad(x))

# Create figure
plt.figure()
plt.xlabel("Angle (deg)")
plt.ylabel("Sine")

# Plot points one by one with a pause to simulate live data taking
for xi, yi in zip(x, y):
    plt.scatter(xi, yi)
    plt.pause(0.2)  # each pause updates the plot in Balthazar

plt.show()  # final version of the plot
The code above produces the following live plot in Balthazar:
Connecting to instruments
Balthazar integrates with instruments using Python libraries such as pyvisa.
Libraries specific to a given instrument can also be imported.
Below is an example of connecting to a Keithley digital multimeter using PyVISA and reading a DC voltage.
import pyvisa

# Create a VISA resource manager
rm = pyvisa.ResourceManager()

# Open a connection to the Keithley instrument over USB
keithley = rm.open_resource("USB0::0x05E6::0x6500::01234567::INSTR")

# Identify the instrument
print(keithley.query("*IDN?"))

# Configure the instrument to measure DC voltage
keithley.write(":SENS:VOLT:DC")

# Read the voltage
voltage = keithley.query(":READ?")

print(f"Measured voltage: {voltage.strip()} V")
Version control with git
Flows are stored in a git repository (such as one on GitHub), making it easy to track both their contents and how they evolve over time.
This provides:
- Automatic branching: a dedicated branch is created for each Flow.
- Built-in versioning: every time a Flow is started, its files are committed, capturing the exact state of the code. When the Space is connected to a remote repository, the commit is pushed there after the Run.
- Full traceability: for every experiment, the exact code that was executed can be inspected.